Home > User Guides > VLE Guide for Instructors > Adding H5P Interactive Content >  Chart

Chart

Chart is an H5P content type that is used for presenting statistical data graphically without having to create the charts manually. Below is an example of the Chart content type.

In order to create a Chart content type:

1. Go to your content bank, click the Add button, and choose Chart. Doing so will redirect you to the Chart editor. Click the Enter Fullscreen button on the top-right of the editor to enable fullscreen editing.

Chart: Choosing Chart in the chooser

2. Type the title you want to give to your new Chart content type in the Title field. This will be useful if you want to search for the content later.

Chart: The title field

3. Choose what type of chart you want to display in the Type of chart section.

Chart: Type of chart section

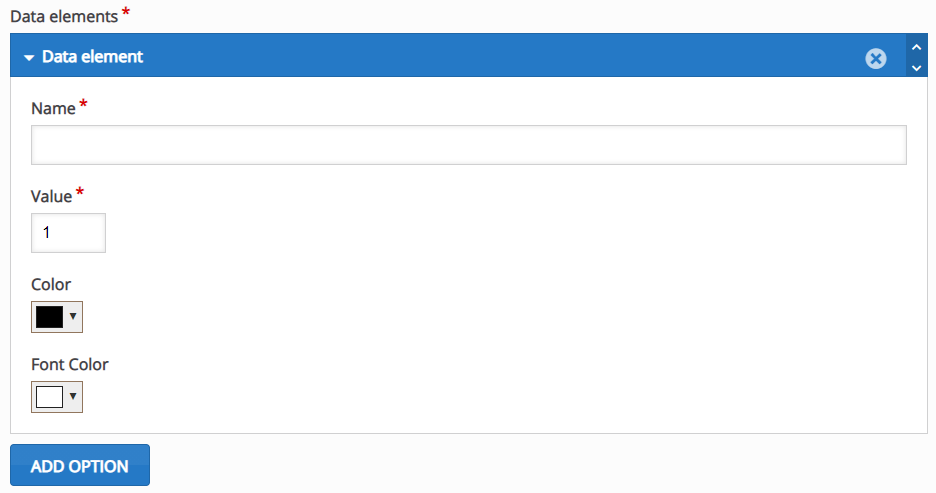
4. Move to the Data elements section. Enter a name and value of an element in the Name and Value fields. Choose the background color and font color of the element in the color choosers. Add data elements as you see fit by clicking the Add option button.

If you want to remove a data element, click the “x” button on the top-right corner. Click the up and down arrows beside the “x” button or drag the blue bar at the top of each data element if you want to rearrange them.

Chart: Data elements section

5. Click the Save button if you are done editing. It will now be added to your content bank for future use.

BACK: Agamotto
NEXT: Collage